


Are you able to make sense of your data and reports? Are you even able to find your data and generate reports?
 Reporting and analytics can give your brokerage valuable insights into brokerage and agent performance. Reporting and analytics can also help you choose the right business strategies to grow your brokerage. And, if your brokerage is a franchise, you probably also have to provide franchise reports.
While reporting and analytics offer major advantages, they can be time-consuming and frustrating. Even after spending hours collecting data, any manual insights your team finds are likely to be error-prone and limited in scope. This can make reporting and analytics seem like more trouble than they’re worth.
However, manually analyzing data and generating reports isn’t your only option. You can streamline the whole process with the right back office software. Wondering how? Let’s take a look at the first way to make reporting and analytics easy – integration.
The first way to make reporting and analytics easier is by integrating your real estate tech solutions.
Creating reports requires data from across your front and back office. If you want to create a report about agent performance, you need transaction data, lead sources, accounting information, pipeline details, and more.
 Manually finding all relevant information and putting it into a spreadsheet not only sucks up hours of your team’s time. It also makes it more likely your reports will be inaccurate due to human error. After your team spends so much time generating a report, there’s no guarantee it will be helpful.
Instead of manually pulling the data you need, you should integrate your front and back office systems. That way, your reporting and analytics software can read data from your CRM, transaction management system, accounting, agent management, commissions, and more.
With integrated reporting and analytics software, your team doesn’t have to waste hours on data management. Instead, they can find the data they need in seconds – freeing them up to focus on high-value activities (like managing more transactions).
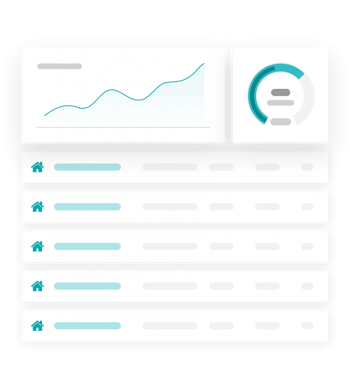
Another way to make reporting and analytics easy is by using a tool that allows you to visualize and organize your data.
 Pulling relevant data is only one step in creating a report. Next, your team has to analyze data to spot trends and derive meaningful insights. To do that, your team has to comb through hundreds or thousands of data points. So much data makes it hard for your team to see patterns and find the insights you need.
But, if you use a tool that provides visualization of the data—through easy to read charts and graphs—you can draw conclusions easily, often intuitively.
With the right tool, you won’t even have to pull the data. It’ll be constantly updated in your reports. You won’t have to worry about your team incorrectly inputting a number or any other mistake that leads to inaccurate conclusions. With real-time data, you keep your finger on the pulse of your business every day.
Along with automating insights, creating customized reports also makes reporting and analytics easy.
Your brokerage has specialized needs. Whether it’s a specific type of franchise report, agent comparison, or brokerage performance metric, you need to create reports that are unique to your brokerage.
If you manage reporting and analytics manually, your team has to gather different data points and run different analyses for each report – which is time-consuming. Even if you use reporting and analytics software, many options lack the specific reports you need (like franchise reports). So, your team has to manually generate these custom reports, which is also a time suck.
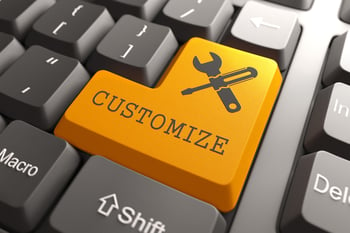 Instead of manually generating specialized reports, you need back office software that can create custom reports. While this software will come standard with some reports, it also lets you quickly create custom reports. You just have to drag and drop the metrics you want to create a custom report in minutes.
With back office software with custom reports, you can get the specialized data, reports, and insights your brokerage needs in minutes. This can save your team hundreds of hours – allowing them to spend more time on the client experience or managing transactions.
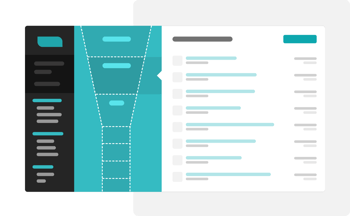
You can also make reporting and analytics easy with dashboards.
Individual reports provide granular details about a specific area, like agent performance or marketing campaign results. However, you need to see the big picture to understand what changes can help your brokerage grow.
Manual reporting and analytics management means your team has to compile all your reports into one, massive report. This can take even longer than generating a single report. By the time your team compiles all the data, it might be too late to act on any insights you find.
 Back office software with reporting dashboards can make seeing the big picture easy. With this software, you can see all of your reports in one place. That way, you can spot any cross-report trends that could help you reach your brokerage goals.
By automatically collecting your reports in one place, back office software with a reporting dashboard makes it easy to see the big picture across your reports.
The last way to make reporting and analytics easy is by being able to generate reports and analyze them from anywhere.
When your team manually analyzes data and creates reports, they usually use a spreadsheet that’s local to one computer. If your team wants to work on the report from a different computer, they have to send that report to the other computer.
Switching a local file between computers can lead to multiple versions of the same report. This can lead to errors and inaccurate insights. Plus, using local files can make it hard for you or your team to work on and view reports from home or on the go.
Instead of using local report files, you should use cloud-based back office software with reporting and analytics. Cloud-based software allows you to access your back office and reports from anywhere on any device. So, your team can create a report at the office, work on it at home, and finish it from a smartphone device.
Plus, the right back office software can centralize your document storage on the cloud. This makes it easy for you and your team to find relevant data, work on reports, and view insights. With less time spent hunting for local files, you can spend your time on what matters (like growing your brokerage).
Reporting and analytics can give you the information you need to grow your brokerage and outperform competitors. But, manually analyzing data and creating reports can be time-consuming, frustrating, and fail to provide the insights you need.
To make reporting and analytics easy, you need to integrate your tech stack, automate insights, customize reports, see the big picture with dashboards, and be able to generate and view reports on the go.
If you’re looking for back office software that can do all that and more, Brokermint is the way to go. Brokermint’s cloud-based, complete back office platform can generate reports for you in minutes. Plus, with its 5 modules (transaction management, accounting, commission automation, agent management, and reporting/analytics), Brokermint has everything you need to streamline your back office.
Sign up for your Brokermint demo today to get started making reporting and analytics easy.

.png "google-play-badge (1)")